A mistake I have seen in many companies is monthly management control.
In this article, I explain what the hidden cost of this system is and what is the best method to accelerate the control cycle, so you can anticipate problems months in advance, before it’s too late.
Monthly management control is a mistake
Most companies with a minimum of structure have an annual budget cycle, and every month they analyze sales data and the income statement to see how things are going.
The problem with the monthly income statement is that it often arrives no earlier than the 15th of the month. Why?
Because to prepare the income statement you need the costs. The bottleneck is personnel costs, which are processed at the close of monthly timesheets. Once verified, including overtime and leave, salaries are processed by the 10th of the month to be paid. Only then can the company record the monthly costs.
Not all management systems are responsive, so with a minimum of processing, we reach the 15th-20th of the month.
A monthly check of the income statement is certainly positive. But you can’t use it to know how the company is really doing.
It’s May 15th and the data you’re looking at refers to the average economic performance of April. That is, with an average delay of one month.
A management delay can be fatal
Here’s a real case (with details changed for privacy):
We are in a shoe factory. On May 15th, you receive a monthly income statement and notice a declining margin for April.
After a series of investigations with various departments, you discover that the problem started months earlier:
- A large order for France was delayed due to logistics issues
- An important contract was lost because the quotes requested in January arrived too late
- The quotes were delayed due to a poorly optimized vacation plan that clogged the office
- The clogging increased due to visits postponed after a trade fair in November
You return to your office disheartened: it’s May 28th and you’ve just discovered that your half-year report will be heavily damaged by a problem that started in early November. More than 7 months later.
The solution starts with measuring the right things
Let’s look at this case (disguised for confidentiality):
- The margin problem impacting April and May is generated backwards by a problem of poor management of quotes that started in November of the previous year.
How could it have been avoided?
By monitoring weekly the number of visits made or the number of projects processed.
The turning point comes by moving from after-the-fact measurements to predictive indicators (lead indicators). And measuring them in time.
Here’s how to do it in 3 steps:
Step 1—Identify the 3-5 predictive indicators that drive your business
As mentioned, we need to shorten and predict the result:
- Move from annual budgets to three-year and quarterly budgets. The year is a period in which results that change the business are rarely achieved, but it’s too far away to be incisive in setting daily priorities.
- 3 months are 13 weeks, a period long enough to make substantial changes and close enough to create urgency.
- Analyze WEEKLY a few but good indicators.
Here are examples of predictive indicators that have proven effective in various sectors:
- Number of new qualified contacts per week (together with a historical ratio between sales in euros and number of contacts, predicts future sales)
- Average response time to quote requests sent during the week (predicts conversion rate)
- Average setup time of machines during the week compared to the total (predicts delays due to production capacity)
- Number of open support tickets (predicts technical workload and cost of poor quality)
Step 2—Create a weekly monitoring system that makes the team accountable
Here’s how to make the weekly control system the most important thing for your team:
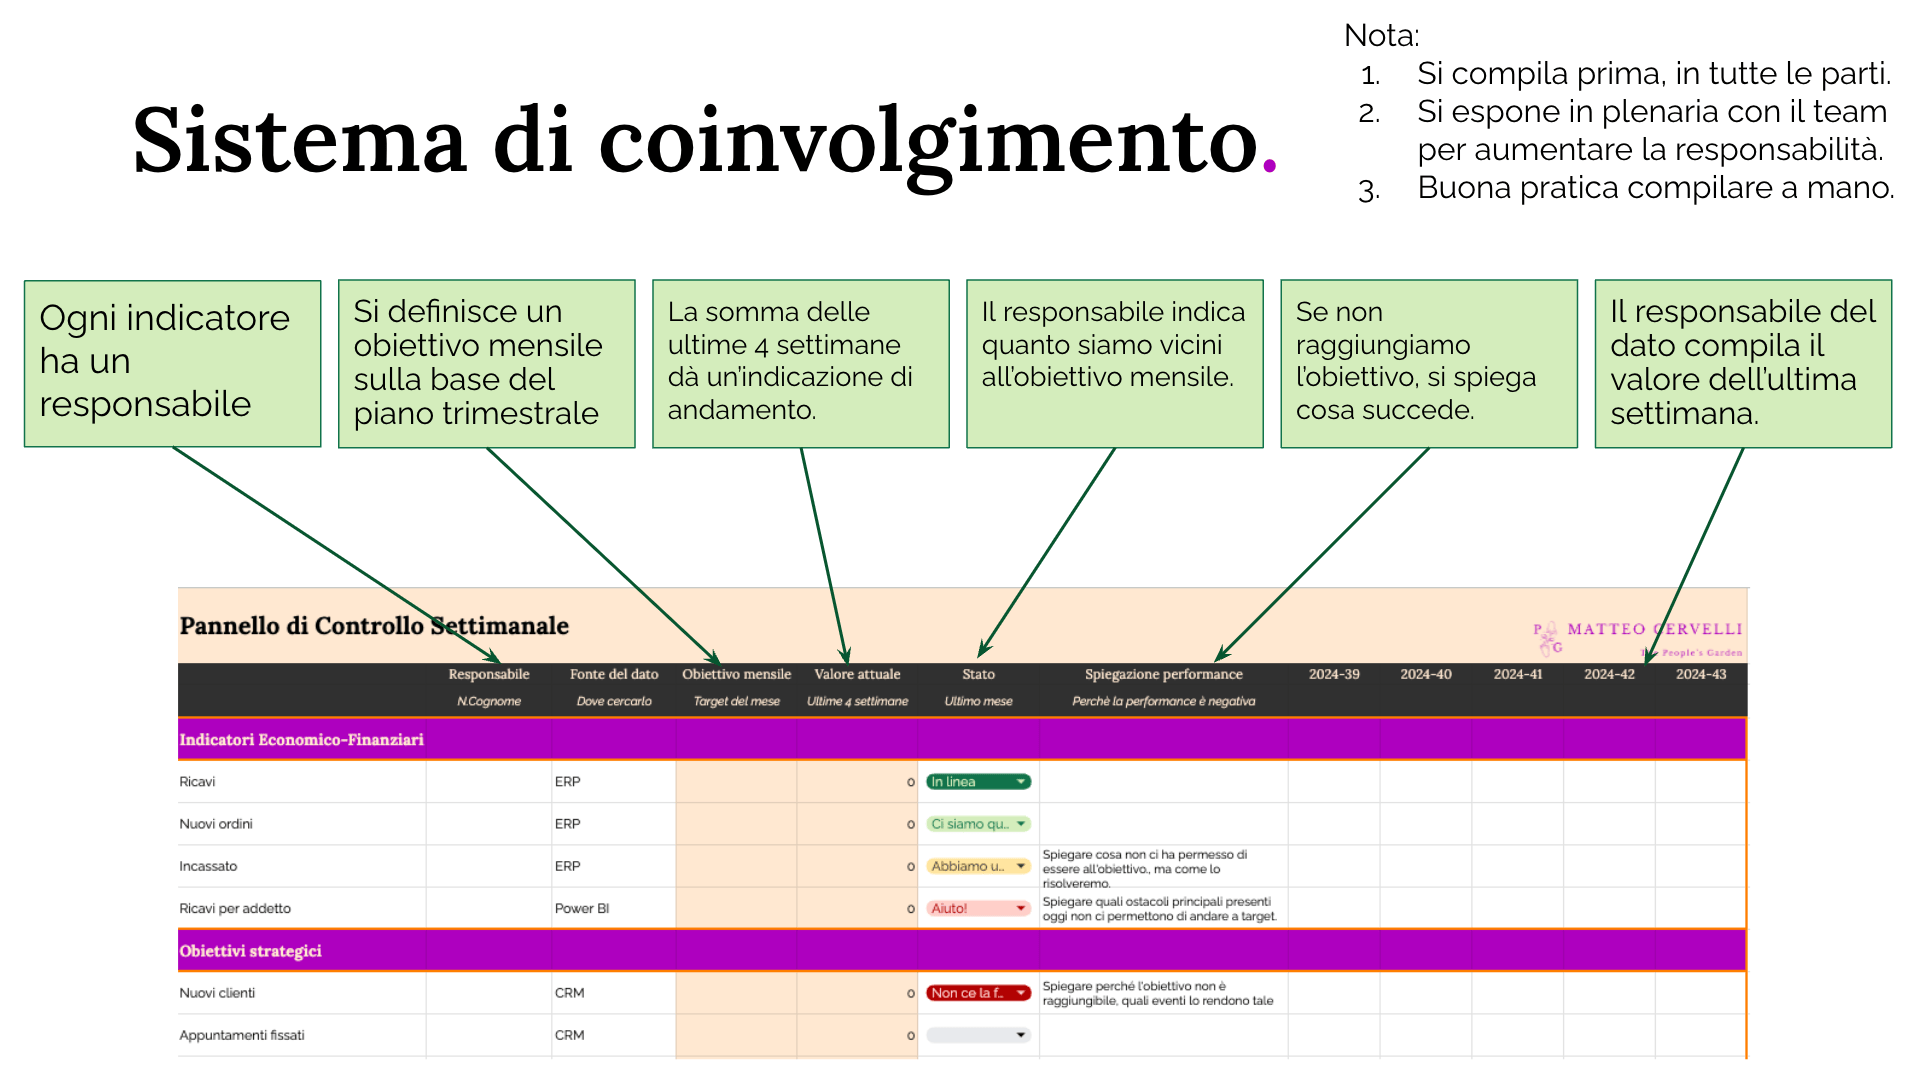
- Each indicator must have a clearly identified owner
- Define a monthly goal based on the quarterly plan
- Every week, before the meeting, the owner calculates the value for the last week. And calculates the average or sum of the last 4 weeks to predict achievement of the monthly goal
- The owner assesses how close you are to the goal
- If the goal is not reached, clearly explain what is happening and what countermeasures are in place
To bring all the data together, you need to build a Weekly Dashboard that becomes the most important and attended meeting for area managers:
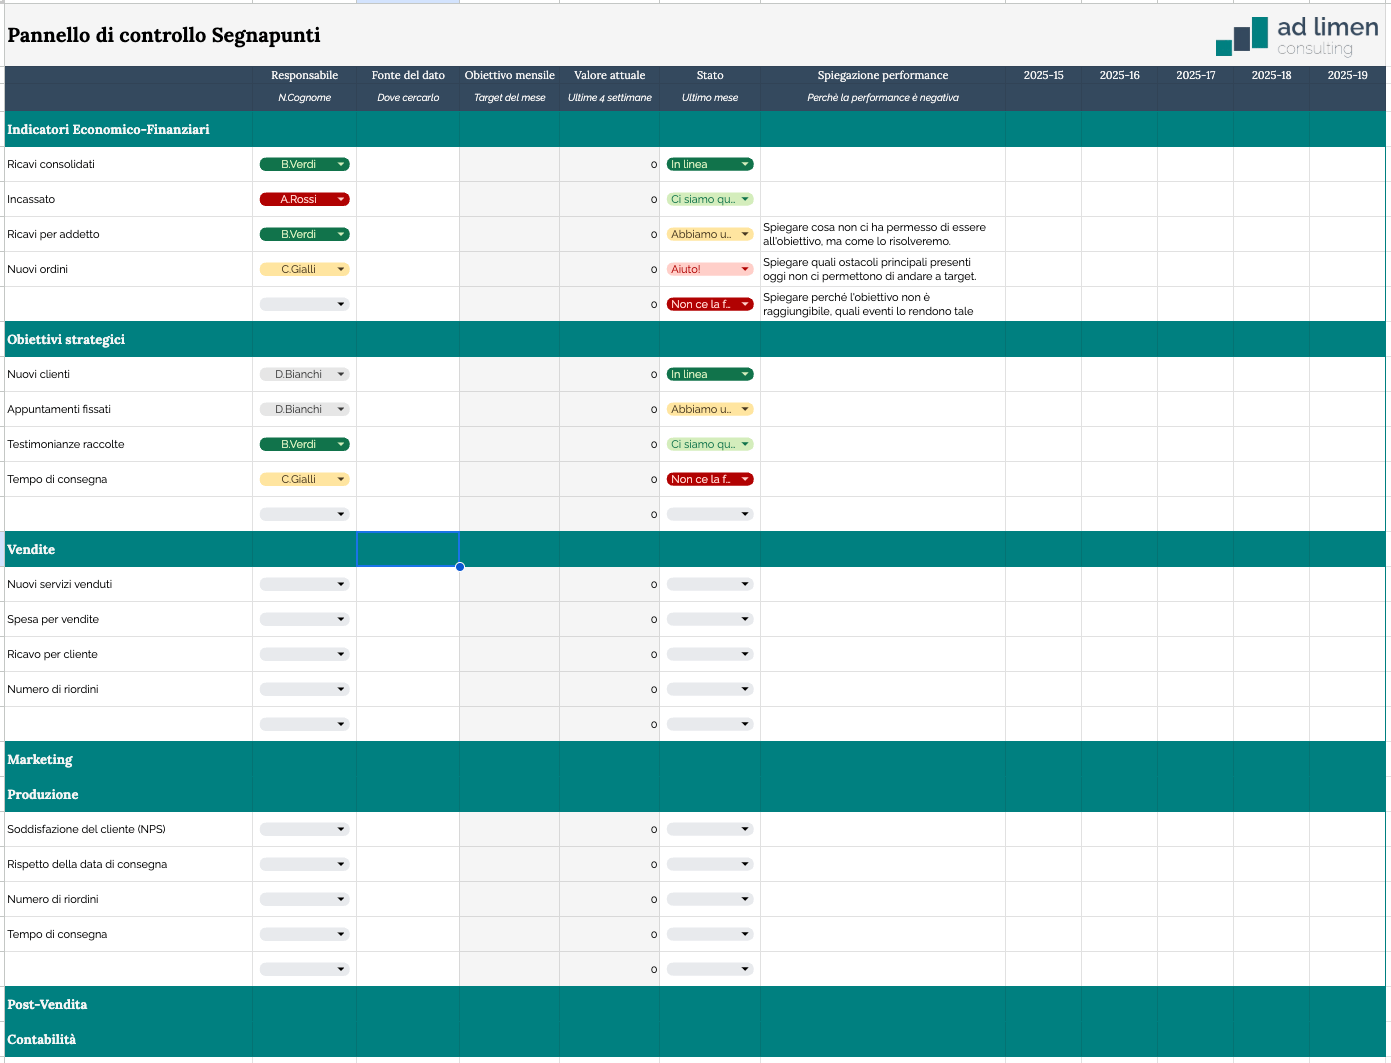
- Arrive at the meeting with the dashboard completed in advance
- Present it in plenary to increase accountability
Avoid using automation for calculation; manual counting creates greater confidence in the data. My advice is to close the data by Friday evening and hold the meeting on Monday morning as the first thing to intervene immediately.
Step 3—Implement feedback cycles to correct course in real time
The week sets the pace and problems emerge immediately. Issues must be investigated as soon as possible:
- In less than 5 days from the event, you have a snapshot of the problem
- The owner comes to the meeting with an immediate solution proposal to apply the following week
- According to the principle of the OODA Loop, move immediately to action and by the next meeting update everyone on the status
- If necessary, collect feedback and intervene even earlier with one or more solution iterations
Organizations that implement this approach identify problems up to 12 weeks earlier than those relying only on monthly reports, with a direct impact on profitability.
Final summary
The month is annoying: it has a variable number of days, almost never starts on a Monday, and has a non-integer number of weeks.
The week is democratic. Always 5 days, it allows you to create fixed meeting routines, synchronized among people; each quarter has exactly 13 weeks, and a year has almost exactly 52 weeks.
Don’t wait for the monthly report anymore to discover problems that are now irreparable. With a well-implemented weekly monitoring system, you’ll always be one step ahead, transforming your company from reactive to proactive.
Organizations that implement this approach identify problems up to 12 weeks earlier than those relying only on monthly reports, with a direct impact on profitability.
To accelerate the implementation of this approach, I have created a complete weekly dashboard template, with examples of predictive KPIs for different sectors and the exact format for review meetings. Download it now and start implementing your weekly monitoring system right away.
Download the Weekly Control Panel
Use this practical tool to immediately implement an effective measurement system in your business and start monitoring scalability systematically.
Download for FreePS: Implementing a new control system can meet resistance. If you have difficulty convincing your team, contact me for a free consulting session on how to overcome organizational obstacles.